
Skift Take
Increased occupancy rates for cities hosting campaign stops in advance of the 2024 U.S. Presidential election did not proportionally translate to higher hotel prices. This unexpected trend invites further examination into how hotels and agencies can analyze data to set up smart, dynamic pricing strategies for one-time events.
This sponsored content was created in collaboration with a Skift partner.
Special events have become big business in travel, as Skift has recently reported through extensive features on the âTaylor Swift economyâ and the impact of sports on local economies. This trend is fully on display in conjunction with the 2024 U.S. Presidential election. As Vice President Kamala Harrisâ somewhat unexpected ascendancy as the Democratic Partyâs presidential candidate in July 2024 breathed fresh life into an already heated toss-up election, political events and rallies on the campaign trail took on new significance for hotel pricing strategies.
This edition of the âData Snapâ explores the impact of Harrisâ and Republican Party Nominee Donald Trumpâs campaign stops across the United States in the 30-day period following Harrisâ announcement of her candidacy. While hotel occupancies grew considerably in cities where the nominees visited, average daily rates (ADR) did not always follow suit in proportion, shedding light on how hotels and travel agencies may approach pricing when they garner anomalous spikes in travel demand from special events.
Campaign Stops Boosted Occupancy â Yet Rates Didnât Rise in Step
According to OnyxInsights data, cities hosting campaign visits saw a noticeable uptick in hotel room nights, far outpacing year-over-year growth in comparison to other cities in their respective states. Occupancy rates for campaign cities were up 16.6 percent over 2023, compared to a decline of 4.6 percent across the states where theyâre located â a 21 percentage point delta.
Despite skyrocketing occupancy, prices did not increase proportionally. ADR was up a healthy 7.9 percent in campaign cities, but that was actually a smaller year-over-year rise than the states where theyâre located, which saw an average ADR increase of 9.4 percent.
How Past Voting Trends Influenced Hotel Demand for Campaign Visits
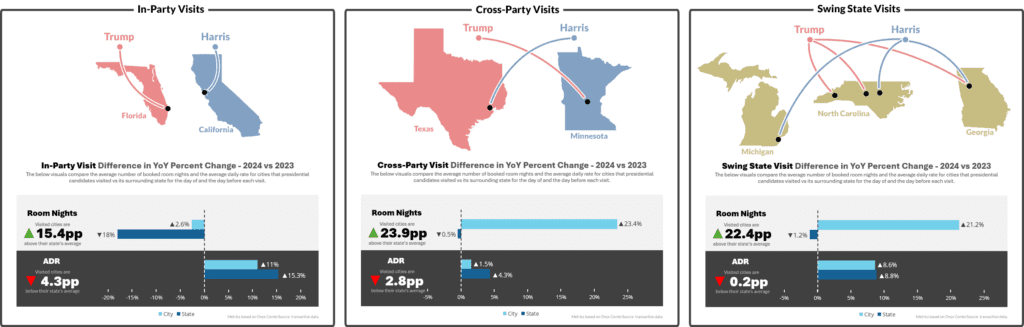
Despite consistent overall trend lines across the country, there were some meaningful differences in hotel occupancy and ADR depending on how a state voted in the 2020 presidential election1.
- âIn-Partyâ visits: Cities that hosted candidates from the party that their state supported in 2020 actually witnessed an occupancy decline from 2023; however, it was still a difference of more than 15 percentage points above the states where they resided. In general, ADRs for âin-partyâ states were far higher than national averages across the board, and ADRs across non-campaign-stop locales were 4.3 percentage points higher than cities hosting political events.
- âCross-Partyâ visits: Among cities located in states that voted for the âotherâ party during the last presidential election â e.g. a Democratic candidate campaign stop in a Republican-voting state â occupancy rates skyrocketed. In 2024, hotel occupancy was up 23.9 percent in these cities, compared to a decline of 0.5 percent across other cities in their states. ADRs in âcross-partyâ cities and states increased the least year over year, and there was a 2.8 percent difference between the two.
- âSwing Stateâ visits: Swing states are the most critical battlegrounds in the U.S. political arena, and they make the most difference in toss-up national elections because they donât reliably vote for one party or another from election to election. Here, room night demand was similar to numbers seen in the âcross-partyâ regions. Meanwhile, ADR growth was much higher than cross-party states, and it was nearly even with only a 0.2 percentage point difference between campaign cities and their respective states.
Why Didnât ADR Track With Increased Occupancy in Campaign Cities?
Occupancy rate data reflects the direct impact of campaign stops on hotel performance metrics. Yet, conventional wisdom would suggest that higher demand based on special events would command higher rates, which did not occur widely.
There are many potential explanations for this counterintuitive outcome, several of which are rooted in practical hotel marketing and pricing strategies. In the U.S. overall, occupancy is down and ADRs are up year over year, according to the Skift Research State of Travel 2024. Thatâs generally reflected in the âcontrolâ markets, i.e. cities where candidates did not visit.
The ADR lag in campaign-stop cities that saw double-digit occupancy gains highlights the nuanced ways in which different types of events influence market dynamics. While yes, more rooms were sold, pricing remained aggressive, perhaps to capitalize on the demand without diluting value.
With the economy and affordability being a No. 1 concern among American voters, accusations of âprice gougingâ could lead to negative brand perception, decreased competitiveness, and potentially even bad publicity for any given hotel. With occupancies near capacity in many cases, moderate ADR increases still would have a significantly positive impact on profitability, and hotels were likely making that calculation.
How Campaign Events Reflect Broader Hotel Pricing Strategies
Presidential elections have an outsized influence on the American psyche, so their impact on travel dynamics is noteworthy in its own right. Yet, this once-every-four-years pattern in the U.S. isnât merely a headline-grabbing anomaly, it applies globally to paint a vivid narrative of how major events ripple through the hospitality sector. Special events require unique pricing strategies, and there isnât a one-size-fits-all approach.
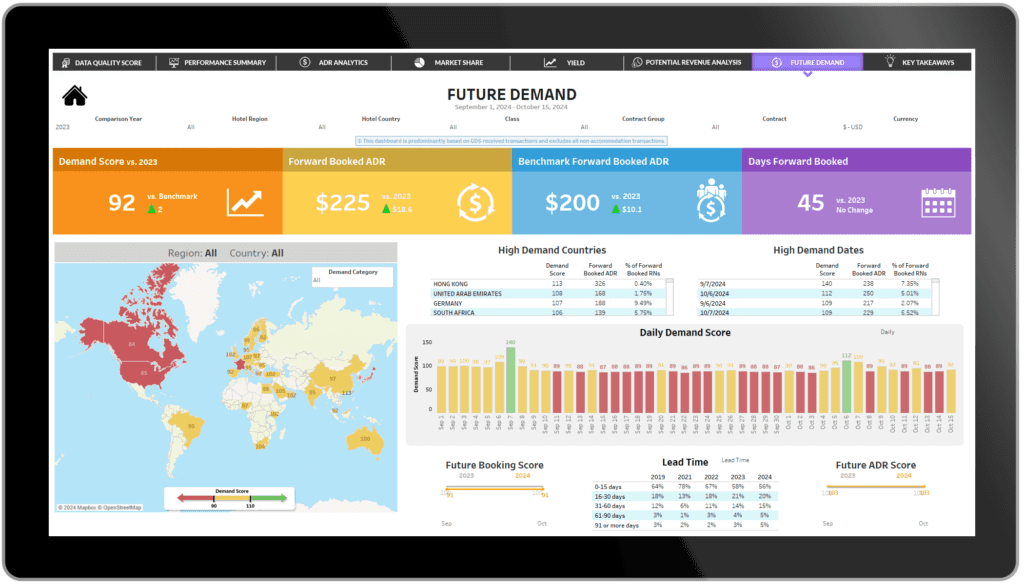
By examining these trends and cultivating data around anomalous travel patterns, hoteliers and agencies can forecast upcoming market conditions with greater accuracy with tools like OnyxInsightsâ Future Demand Dashboard (shown below). They can use deeper data analytics to gain a deeper understanding of how significant events like political rallies (and sporting tournaments or concert tours) that bring transient spikes in demand can shape consumer behavior and drive economic cycles within the hospitality industry.
âThe Data Snapâ is a monthly article series that paints a clearer picture of the dynamic hotel booking landscape, empowering hotels and agencies to make data-driven decisions that help them build productive partner relationships and drive more revenue.
OnyxInsights offers a comprehensive view of the industry landscape, enabling hotels and TMCs to make well-informed decisions and better serve their clients and partners. Onyx CenterSource processes over 100 million transactions annually on behalf of 200,000 agencies and 150,000 hotels globally, representing nearly $2.1 billion in hotel commission payments. Visit onyxcentersource.com to learn more.
This content was created collaboratively by Onyx CenterSource and Skiftâs branded content studio, SkiftX.